HREOC Website: Isma - Listen: National consultations on eliminating prejudice against Arab and Muslim Australias
Consultations
Homepage
|| Fact Sheet
FACT SHEET:
Muslim & Arab Australians in New South Wales
1. Muslim Australians
- Total number
of Muslims in Australia: 281,578 - Total number
of Muslims in New South Wales: 140,097 - Proportion
of the Australian population who are Muslim: 1.5% - Proportion
of the NSW population who are Muslim: 2.2%
*Source: Australian Bureau of Statistics (ABS), 2001
Census.
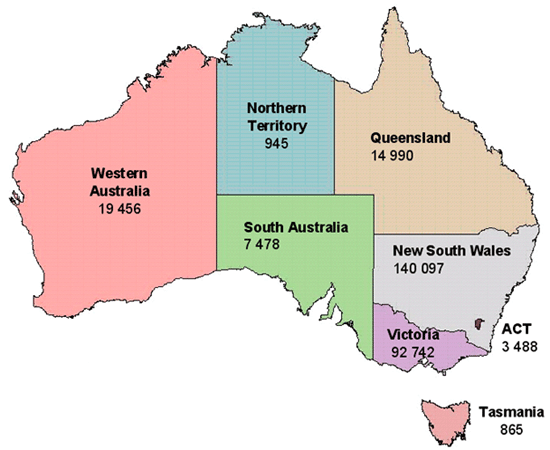
Figure 1:
Australian Muslim population by state and territory
Source:
ABS, 2001 Census. Basic Community Snapshots and Profiles.
Click here for text only version.
Table 1: Geographic
Distribution of Muslims in Australia, 2001
|
State/territory
|
Proportion
of all Australian Muslims |
Proportion
of total state or territory population |
| New South Wales |
50% | 2.2% |
| Victoria | 33% | 2.0% |
| Western Australia |
7% | 1.1% |
| Queensland | 5% | 0.4% |
| South Australia |
3% | 0.5% |
| Australian Capital Territory |
1% | 1.1% |
| Northern Territory |
0.3% | 0.5% |
| Tasmania | 0.3% | 0.2% |
Total |
100% |
1.5% |
Source:
ABS, 2001 Census.
Table 2: Distribution
of Australian Muslims by major statistical local areas in Sydney, 2001
| Statistical local area |
Number |
| Bankstown (C) | 19,538 |
| Canterbury (C) | 15,073 |
| Auburn (A) | 13,083 |
| Liverpool (C) | 11,554 |
| Parramatta (C) | 10,025 |
| Rockdale (C) | 7,206 |
| Fairfield (C) | 6,829 |
| Holroyd (C) | 5,267 |
| Campbelltown (C) |
4,778 |
| Blacktown (C) - South-West |
4,009 |
| Blacktown (C) - South-East |
3,647 |
| Botany Bay (C) | 2,946 |
| Marrickville (A) |
2,789 |
| Penrith (C) | 2,394 |
| Hurstville (C) | 2,209 |
| Baulkham Hills (A) |
2,090 |
| Hornsby (A) | 1,996 |
| Ryde (C) | 1,856 |
| Randwick (C) | 1,849 |
| Kogarah (A) | 1,558 |
| South Sydney (C) |
1,523 |
| Blacktown (C) - North |
1,460 |
2. Arab &
Middle-Eastern Australians
- Total number of
Australians born in the Middle East or North Africa in Australia: 213,940
(1.1% of the national population) - Total number Australians
born in the Middle East or North Africa in New South Wales: 126,697
(2% of the NSW state population)
*Source: Australian
Bureau of Statistics (ABS), 2001 Census.
Definitions
Defining who is an
‘Arab’ or exactly which countries lie within the Middle East
is a complex matter.
The Australian Bureau
of Statistics (ABS) defines the Middle East as: Bahrain,
Gaza Strip and West Bank (Palestine), Iran, Iraq, Israel, Jordan, Kuwait,
Lebanon, Oman, Qatar, Saudi Arabia, Syria, Turkey, United Arab Emirates,
Yemen. North Africa is defined as: Algeria, Egypt, Libya,
Morocco, Sudan, Tunisia and the Western Sahara. ‘Arab’
includes: Algerian, Egyptian, Iraqi, Jordanian, Kuwaiti, Lebanese, Libyan,
Moroccan, Palestinian, Saudi Arabian, Syrian, Tunisian.
This summary uses
ABS definitions and highlights specific countries of origin for a significant
number of Australians. These countries are: Lebanon, Egypt, Turkey, Iraq,
Iran, Syria and Israel. Other Middle Eastern, North African and Arab countries
with much smaller representation in Australian are grouped into two categories:
- ‘Other Middle
East’ (which includes Bahrain, Jordan, Kuwait, Oman, Palestine,
Qatar, Saudi Arabia, United Arab Emirates and Yemen) - ‘Other North
Africa’ (which includes Algeria, Libya, Morocco, Sudan, Tunisia,
Mauritania, Djibouti and Western Sahara)
Table 3: Main countries of
birth of Australians of Middle Eastern & North African origin, 2001
|
Country
of birth |
Number
|
| Lebanon | 71 349 |
| Egypt | 33 432 |
| Turkey | 29 821 |
| Iraq | 24 832 |
| Iran | 18 789 |
| Syria | 6 710 |
| Israel | 6 574 |
| Other Middle East |
13 212 |
| Other North Africa |
8 918 |
| Other not further defined |
303 |
Total |
213
|
Source: ABS, 2001
Census, Unpublished data.
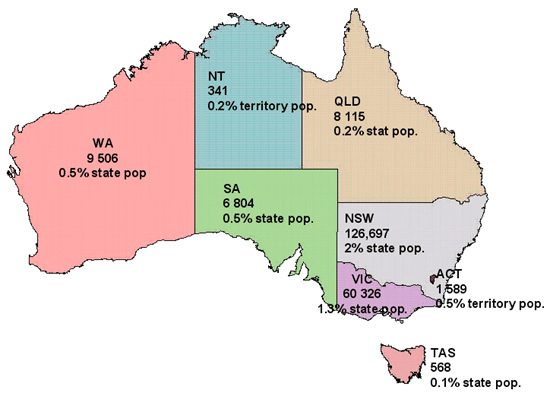
Figure 2:
State & territory distribution of Australians born in the Middle East
& North Africa, 2001
Source: ABS, 2001
Census. Basic Community Profiles and Snapshots.
Click here for text only version.
Table 4: Australians born
in the Middle East or North Africa in major statistical local areas of
Sydney, 2001
|
Statistical
Local Area |
Egypt
|
Iran
|
Iraq
|
Lebanon
|
Syria
|
Turkey
|
Other
Middle East |
Other
North Africa |
Total
|
| Fairfield (C) |
535
|
1078
|
7881
|
2178
|
681
|
838
|
844
|
192
|
14227
|
| Bankstown (C) |
1108
|
108
|
362
|
10647
|
634
|
323
|
651
|
178
|
14011
|
| Canterbury (C) |
1088
|
90
|
481
|
7552
|
461
|
272
|
621
|
321
|
10886
|
| Parramatta (C) |
442
|
1008
|
533
|
5998
|
281
|
827
|
394
|
151
|
9634
|
| Liverpool (C) |
791
|
521
|
2200
|
3035
|
184
|
453
|
402
|
370
|
7956
|
| Auburn (A) |
155
|
169
|
928
|
2434
|
148
|
2487
|
329
|
91
|
6741
|
| Holroyd (C) |
377
|
469
|
481
|
3806
|
183
|
667
|
307
|
137
|
6427
|
| Rockdale (C) |
1201
|
73
|
151
|
2751
|
51
|
279
|
133
|
85
|
4724
|
| Blacktown (C) - S-East |
654
|
284
|
131
|
768
|
113
|
513
|
242
|
473
|
3178
|
| Ryde (C) |
356
|
1003
|
118
|
915
|
226
|
161
|
237
|
34
|
3050
|
| Blacktown (C)-West |
526
|
164
|
519
|
547
|
68
|
486
|
213
|
418
|
2941
|
| Hornsby (A) |
286
|
993
|
43
|
741
|
29
|
128
|
190
|
41
|
2451
|
| Campbelltown (C) |
580
|
104
|
194
|
929
|
106
|
101
|
291
|
71
|
2376
|
| Baulkham Hills (A) |
448
|
636
|
71
|
771
|
56
|
195
|
227
|
33
|
2437
|
| Penrith (C) |
585
|
244
|
199
|
559
|
78
|
226
|
186
|
78
|
2155
|
| Randwick (C) |
802
|
214
|
187
|
467
|
30
|
190
|
89
|
94
|
2073
|
| Botany Bay (C) |
583
|
133
|
391
|
252
|
25
|
482
|
46
|
84
|
1996
|
| Hurstville (C) |
776
|
48
|
39
|
858
|
46
|
47
|
83
|
93
|
1990
|
| Marrickville (A) |
290
|
43
|
35
|
1100
|
73
|
323
|
51
|
60
|
1975
|
| Warringah (A) |
320
|
477
|
55
|
194
|
138
|
155
|
93
|
65
|
1497
|
| Blacktown (C) - North |
388
|
232
|
43
|
294
|
17
|
227
|
135
|
73
|
1409
|
| Kogarah (A) |
498
|
32
|
39
|
632
|
16
|
61
|
36
|
51
|
1365
|
| Willoughby (C) |
214
|
350
|
35
|
348
|
147
|
100
|
95
|
33
|
1322
|
| South Sydney (C) |
179
|
99
|
38
|
388
|
20
|
235
|
71
|
62
|
1092
|
| Burwood (A) |
127
|
32
|
7
|
729
|
31
|
94
|
46
|
23
|
1089
|
| Strathfield (A) |
234
|
29
|
12
|
577
|
31
|
89
|
66
|
39
|
1077
|
| S’land Shire (A) - West |
460
|
20
|
32
|
365
|
27
|
44
|
60
|
25
|
1033
|
| S’land Shire (A) - East |
493
|
29
|
24
|
238
|
20
|
65
|
46
|
22
|
937
|
| Ku-ring-gai (A) |
154
|
423
|
16
|
128
|
19
|
72
|
86
|
21
|
919
|
| Ashfield (A) |
113
|
45
|
13
|
378
|
29
|
113
|
28
|
58
|
777
|
| Waverley (A) |
214
|
72
|
57
|
95
|
5
|
77
|
33
|
66
|
619
|
| Concord (A) |
128
|
19
|
8
|
288
|
9
|
80
|
24
|
8
|
564
|
| Lane Cove (A) |
102
|
161
|
13
|
73
|
15
|
60
|
31
|
15
|
470
|
| North Sydney (A) |
117
|
126
|
24
|
60
|
15
|
62
|
34
|
27
|
465
|
| Woollahra (A) |
185
|
59
|
42
|
61
|
3
|
40
|
22
|
35
|
447
|
| Leichhardt (A) |
109
|
50
|
12
|
126
|
9
|
78
|
32
|
18
|
434
|
| Gosford (C) |
160
|
64
|
10
|
77
|
14
|
33
|
24
|
29
|
411
|
| Drummoyne (A) |
173
|
25
|
6
|
95
|
7
|
100
|
12
|
8
|
426
|
| Wyong (A) |
150
|
23
|
16
|
53
|
11
|
23
|
22
|
11
|
309
|
| Camden (A) |
40
|
14
|
24
|
117
|
3
|
13
|
12
|
8
|
231
|
| Manly (A) |
82
|
41
|
7
|
12
|
0
|
48
|
12
|
32
|
234
|
| Hawkesbury (C) |
32
|
30
|
10
|
88
|
6
|
11
|
6
|
8
|
191
|
| Blue Mountains (C) |
52
|
16
|
17
|
58
|
6
|
17
|
11
|
7
|
184
|
| Sydney (C) - Remainder |
23
|
35
|
4
|
35
|
6
|
28
|
37
|
9
|
177
|
| Hunter's Hill (A) |
51
|
38
|
9
|
39
|
6
|
13
|
9
|
5
|
170
|
| Pittwater (A) |
36
|
40
|
8
|
31
|
5
|
9
|
20
|
8
|
157
|
| Mosman (A) |
48
|
37
|
11
|
17
|
8
|
19
|
12
|
13
|
165
|
| Wollondilly (A) |
19
|
20
|
13
|
89
|
0
|
5
|
10
|
6
|
162
|
| Sydney (C) - Inner |
22
|
10
|
6
|
15
|
0
|
6
|
6
|
5
|
70
|
| Total for Sydney SD |
16506
|
10030
|
15555
|
52008
|
4096
|
10975
|
6667
|
3794
|
119631
|
*Source: ABS, 2001 Census, Unpublished data
Race Discrimination
Unit, Human Rights and Equal Opportunity Commission, July 2003. ABS data
used with permission from the Australian Bureau of Statistics.


